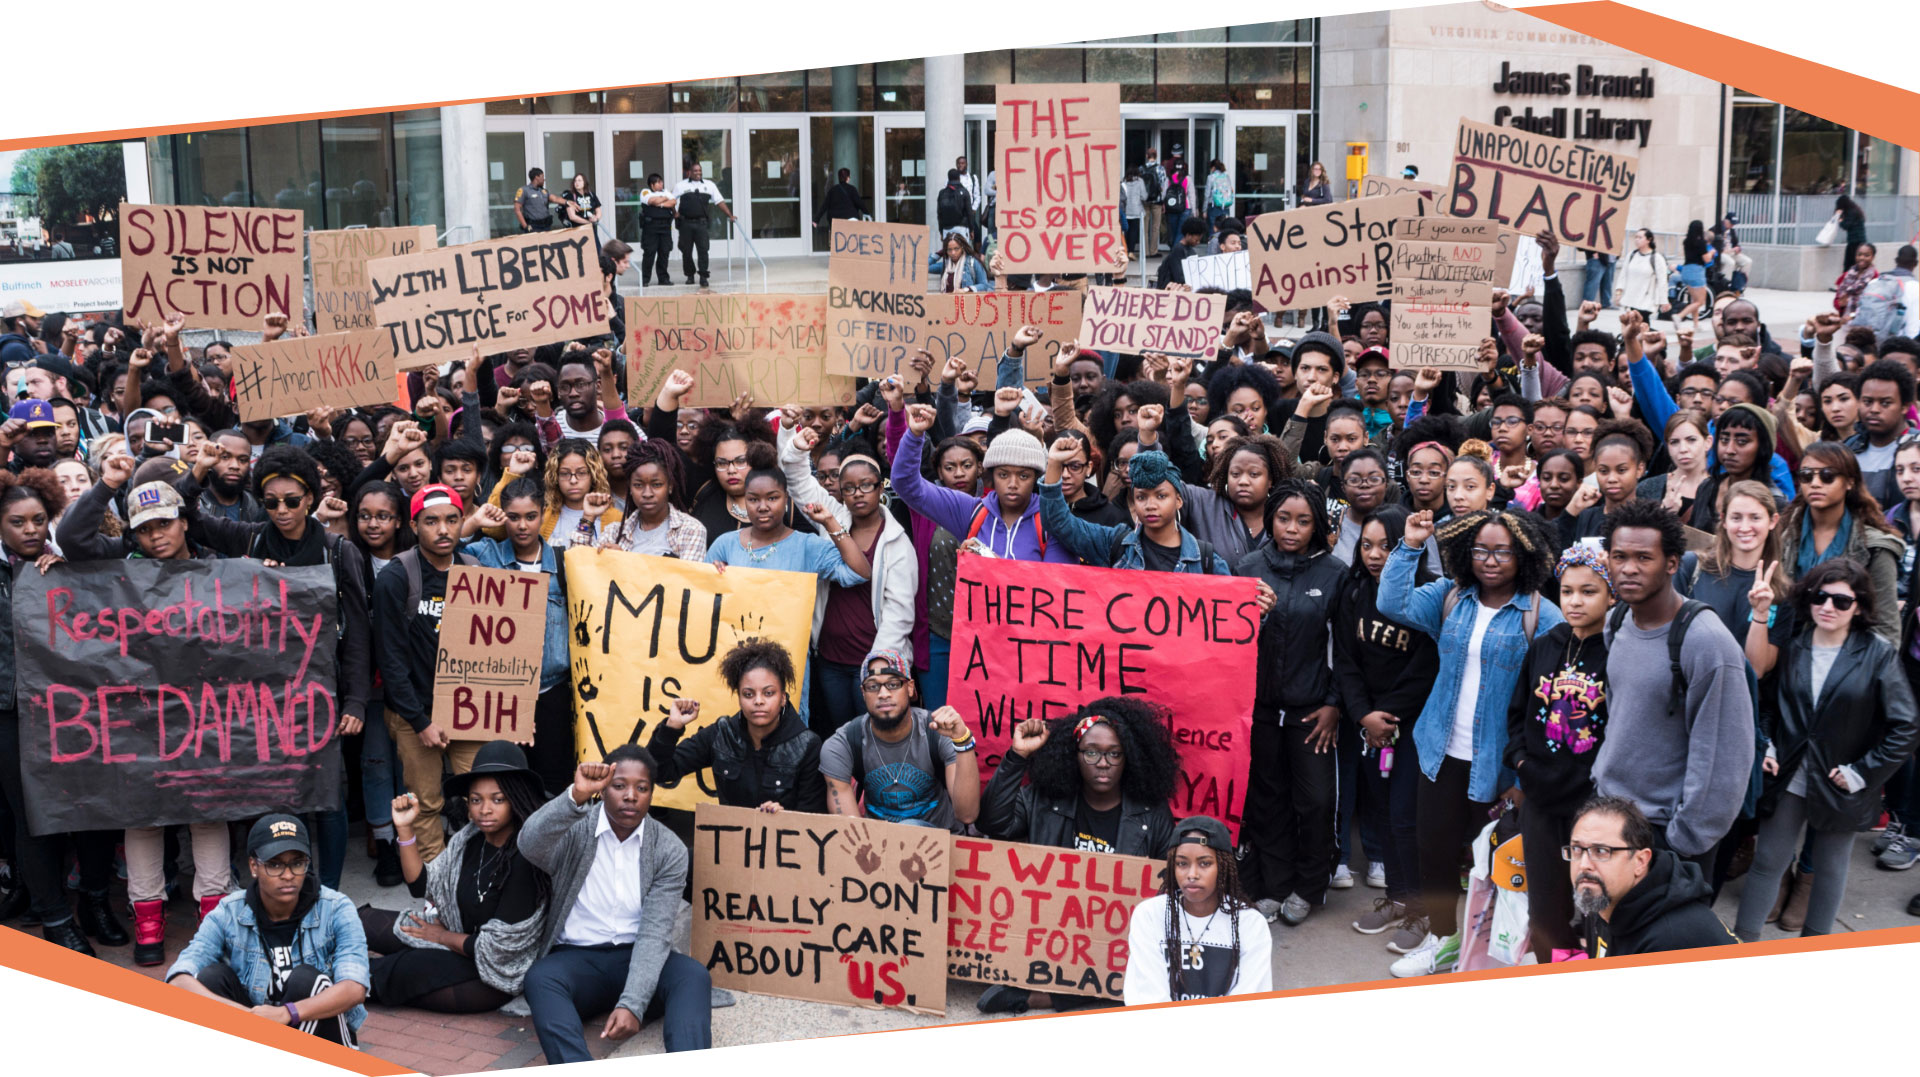
None of us at the time realized that an online post about a racist encounter in Columbia, Missouri would lead to a series of events with potential to change the demographic landscape of higher education. In September 2015, a University of Missouri (Mizzou) student subjected to racial abuse took to Facebook to decry bigotry, homophobia, and racism. What occurred in the weeks that followed raised the nation’s collective consciousness about the plight of black students enrolled at predominantly white colleges and universities. Without question, Mizzou had become the epicenter of a movement that sought to affirm the value of black lives in academia.

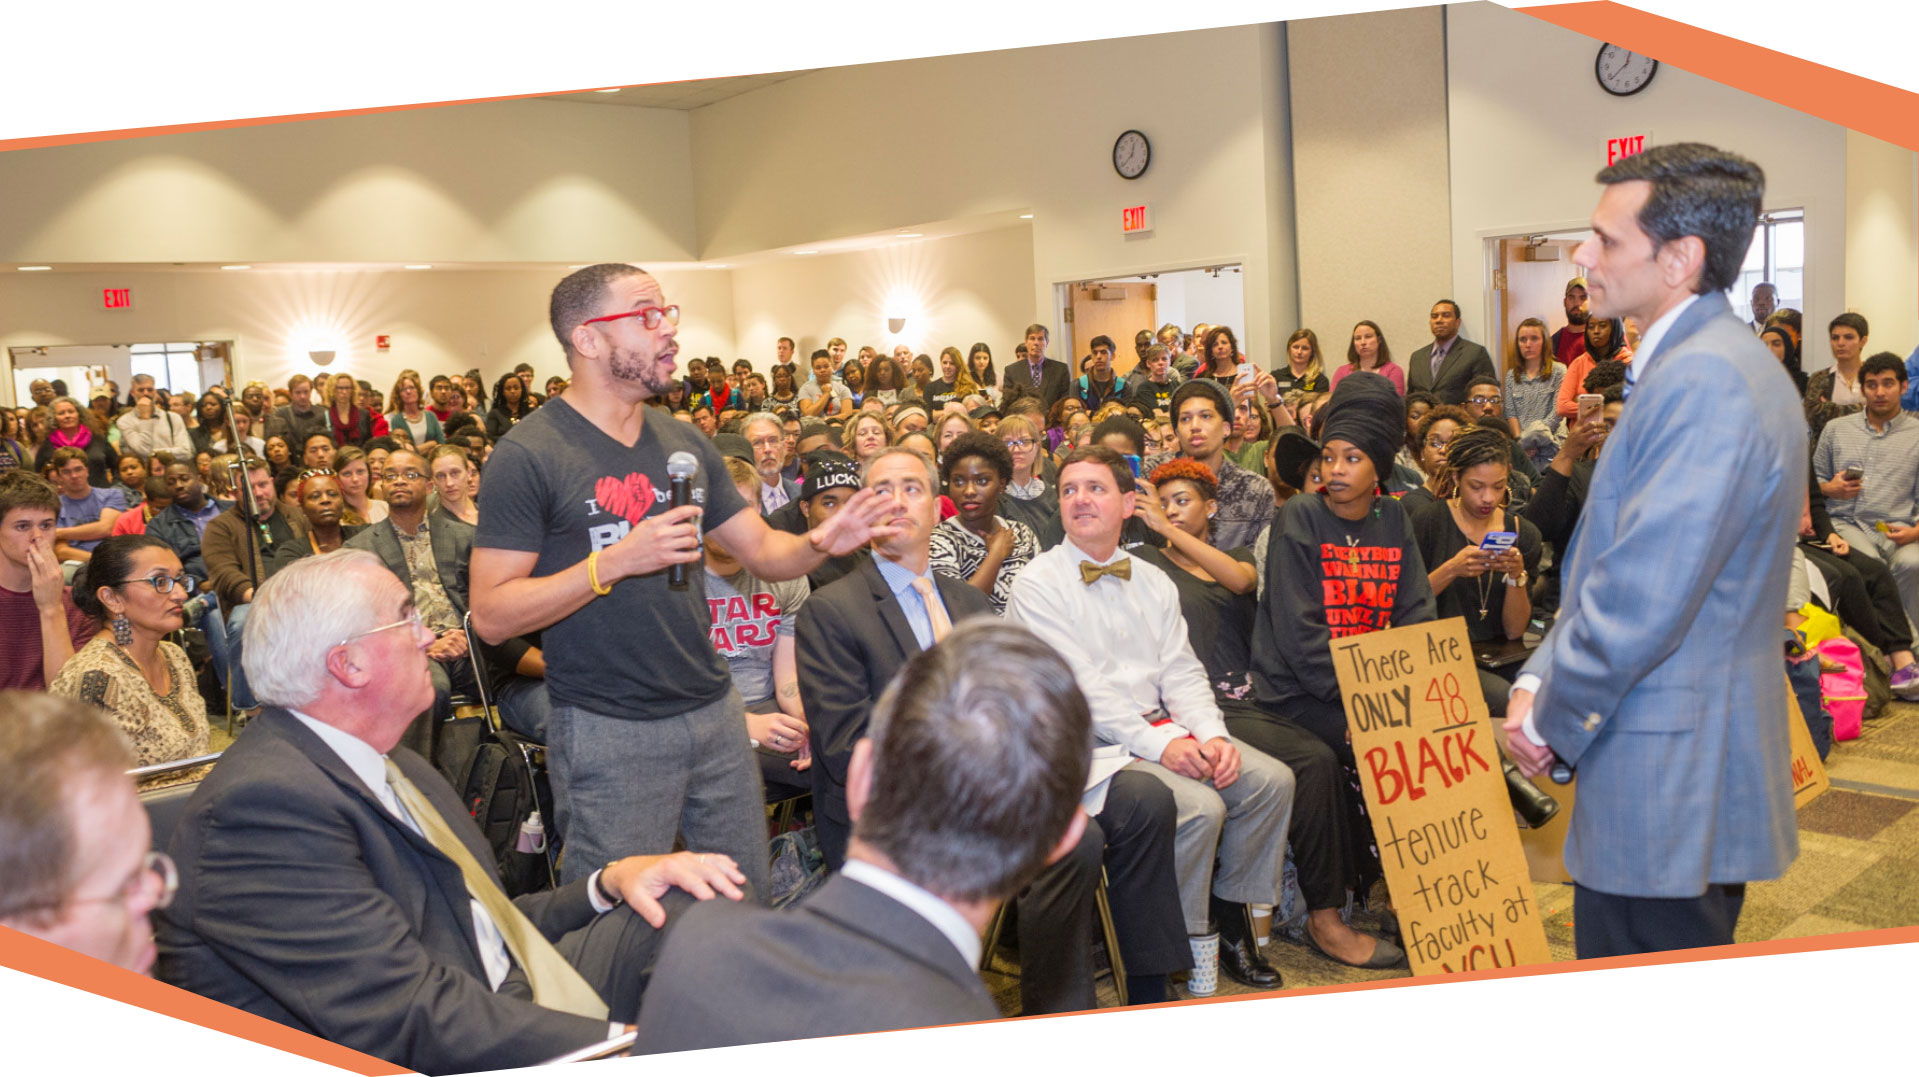
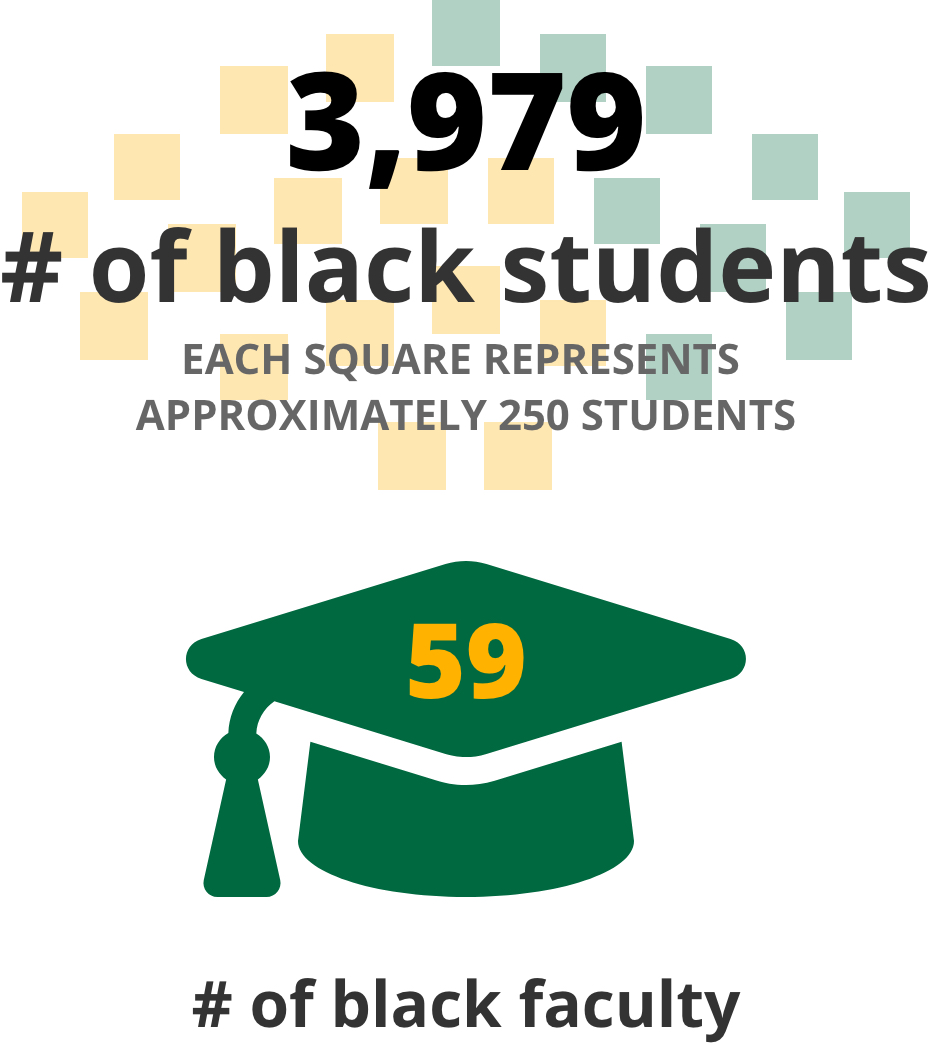
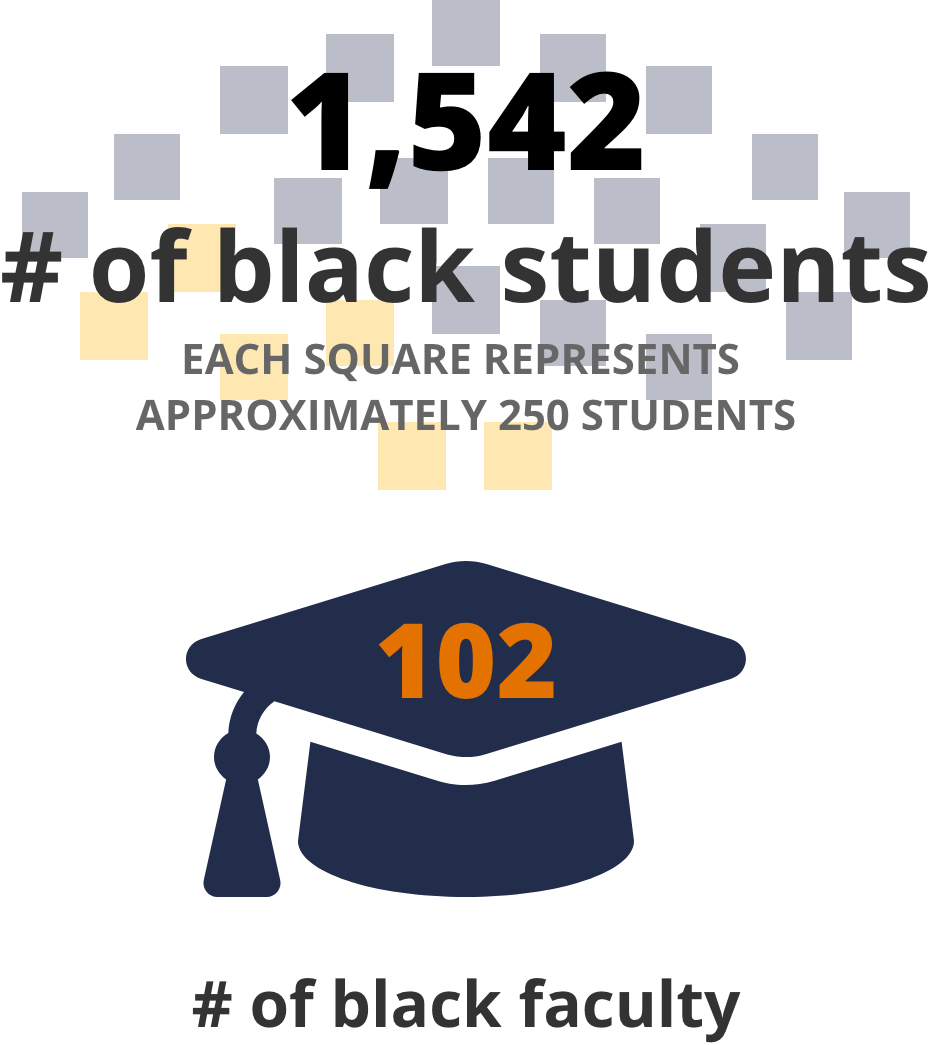
Nine hundred forty-five miles to the east, Virginia Commonwealth University (VCU) students -- still reconciling a racialized incident involving a University of Virginia (UVA) student earlier that spring -- held protests and joined solidarity marches in support of Mizzou students. By November 2015, VCU students had cosigned to several lists of demands with students from dozens of other universities. The most prominent demand on each of these lists was for their respective universities to increase faculty diversity; and, at VCU, that meant increasing the percentage of black faculty from 4.7% to 10% by 2018.

We focus on the years immediately preceding VCU student demands (2012-2014) and the year of affirmation and beyond (2015-2018).

The call for increasing black faculty was related to students’ desire to have black faculty as intellectual authorities in the classroom; to engage with faculty in creative activity, research and scholarship relevant to their lived experiences; to seek guidance from faculty as mentors, role models, and support persons in both personal and professional capacities; to work with faculty to build intercultural competence among their student coevals and other faculty; and in some cases, simply to see representations of themselves in the academy.

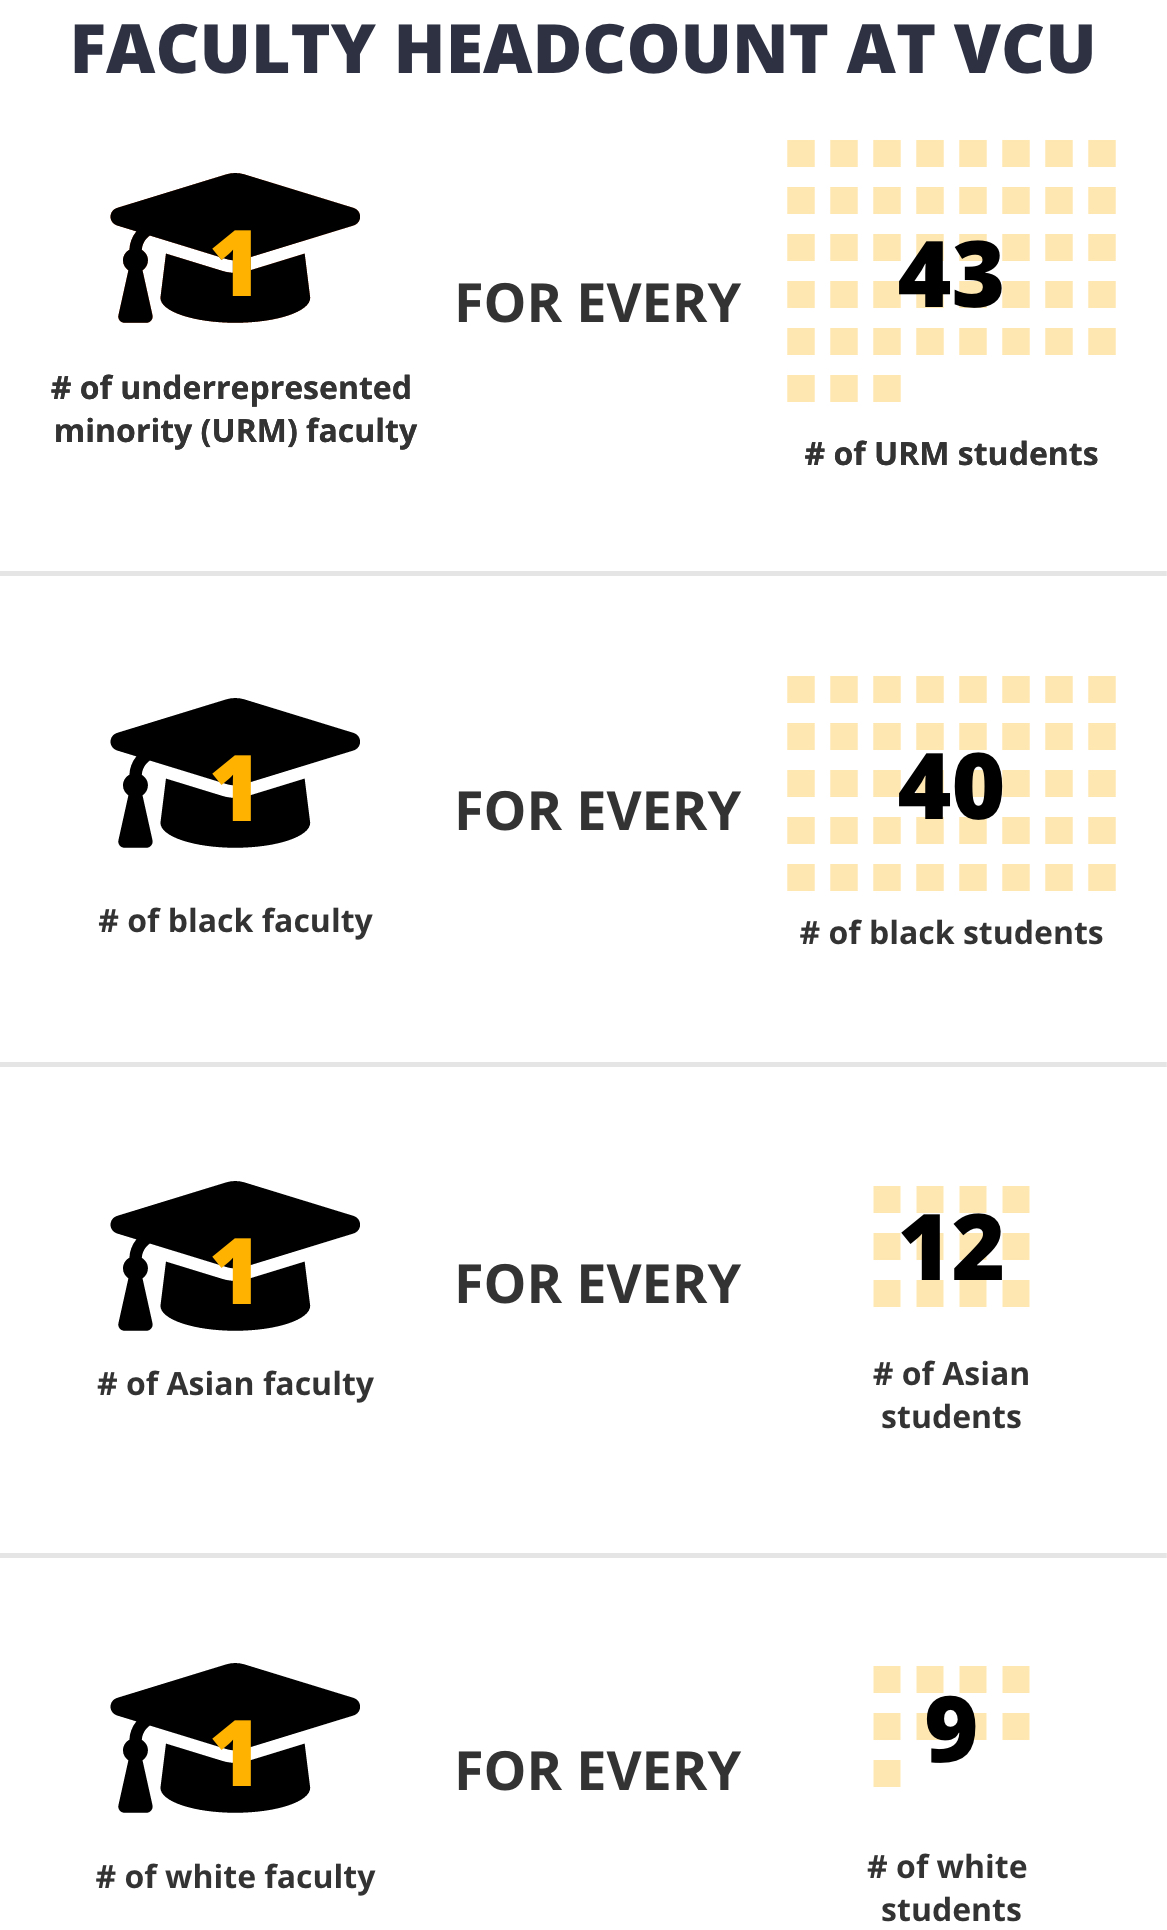
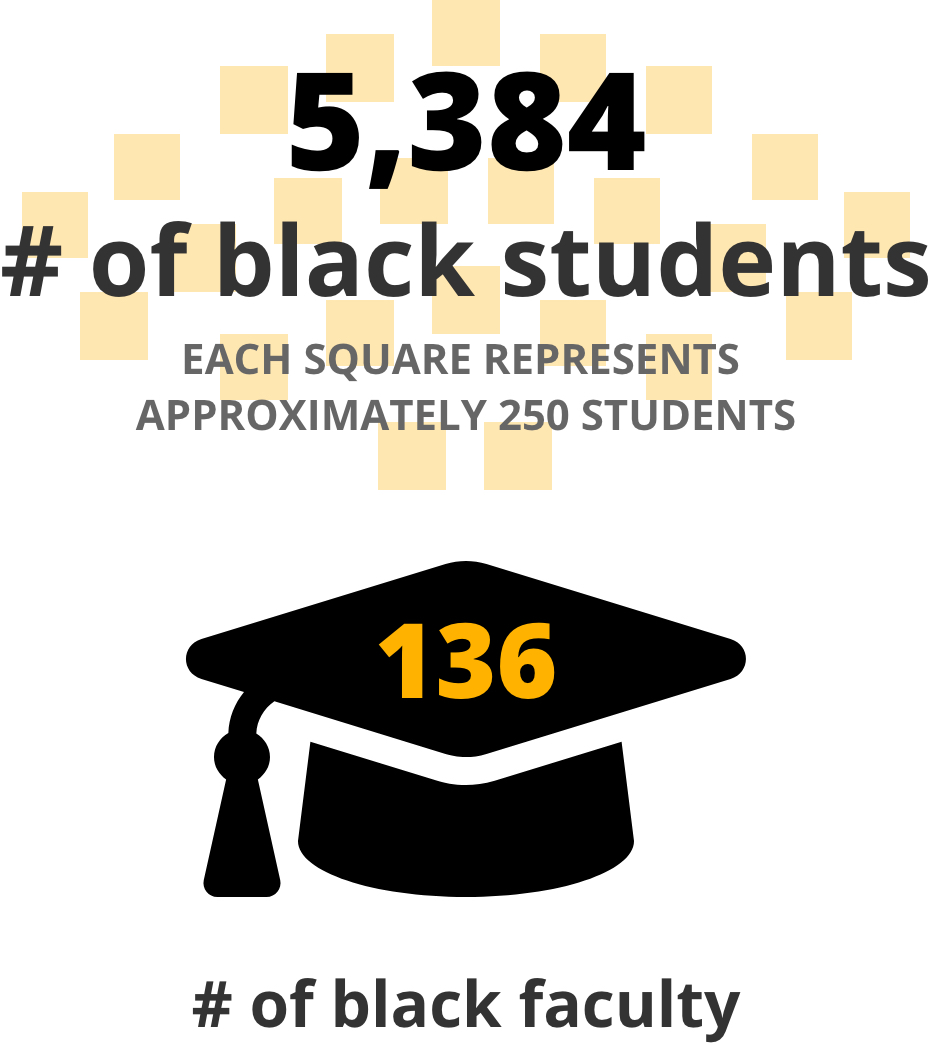
It has been a few years since that affirmation period circa Fall 2015. So, let’s take a look at how VCU responded to the call for increasing its black faculty. In this brief report, we examine VCU’s black faculty headcount, faculty-to-student proportional representation, faculty recruitment and retention, faculty turnover, and faculty success in terms of promotion and tenure. We focus on the years immediately preceding VCU student demands (2012-2014) and the year of affirmation and beyond (2015-2018). When available, we provide comparison data to other Carnegie Level 1 (R1) Doctoral Universities - Very High Research Activity institutions in the Commonwealth to better gauge VCU’s progress and relative standing.

VCU student protest outside Cabell library in 2015
VCU students demonstrated in solidarity with U. Mo. in the Compass in 2015. (Travis Ellison for the Commonwealth Times)

Key Findings

On black faculty headcount...

Faculty headcount is a census of how many faculty members are employed by a university. We used the Integrated Postsecondary Education Data System (IPEDS) to generate faculty headcount data (2012-2018) from a common source for VCU and other research universities (University of Virginia, George Mason University, and Virginia Tech). IPEDS only reports on instructional faculty, which means the faculty role requires 50% or more of teaching. We make note when referring to instructional faculty rather than Teaching & Research (T&R) faculty, which is a broader faculty category. Importantly, VCU did not submit data to IPEDS in 2012, which was an optional reporting year. As a consequence, we do not report on 2012 data in our comparative analyses.

Between 2013 and 2018, VCU’s instructional faculty headcount increased from an estimated 2,107 to 2,187. This is roughly a 3.8% increase in instructional faculty. During this time period, the number of black faculty also increased. The number of black faculty at VCU increased from 105 (4.98%) in 2013 to 136 (6.22%) in 2018. The +29.5 ppt increase among black faculty exceeded growth among all underrepresented minority (URM; African American/Black, Hispanic/Latinx, Native Hawaiian, Pacific Islander, two or more races, when one from preceeding group) faculty (24.1%), Asian faculty (22.4%), and white faculty (-2.6%) at VCU.

Table 1 - Head count by race/ethnicity, VCU

Notably, a substantial proportion of the increase in VCU’s black instructional faculty headcount occurred from 2015 to 2018. Between 2013 and 2014, VCU’s black instructional faculty headcount decreased -1.9 ppt. However, between 2015 and 2018, black instructional faculty headcount increased a total of +30.7 ppt. The increases in black instructional faculty headcount were due primarily to growth among black women in the professoriate. For instance, between 2013 and 2018, black women instructional faculty increased +50.9 ppt (from 55 to 83), whereas black men faculty increased only +6 ppt (from 50 to 53).

We also see evidence of a rather robust response by the university beginning 2015 and beyond. The average headcount for black women instructional faculty between 2013 and 2014 was 56; however, the average headcount between 2015 and 2018 was 68.5. This is compared to black men instructional faculty, when their average headcount increased from 48 (2013-2014) to 52 (2015 and 2018).

When comparing VCU’s black instructional faculty headcount to other research universities, in Fall 2018, there were more black instructional faculty at VCU (136) than at UVA (102), and at VT (65) and GMU (59) combined.

Table 2 - Black instructional faculty across R1 institutions in Virginia

This is especially true among black women instructional faculty, where at VCU there were 88 compared to 49 at UVA, 31 at GMU, and 28 at VT. In fact, in 2018, among all of the black instructional faculty employed by research universities in Virginia, 4 in 10 black women faculty were employed by VCU. (Note: 3 in 10 black men faculty were employed by VCU).

Infographic displaying faculty employment proportion against other research schools in Virginia 
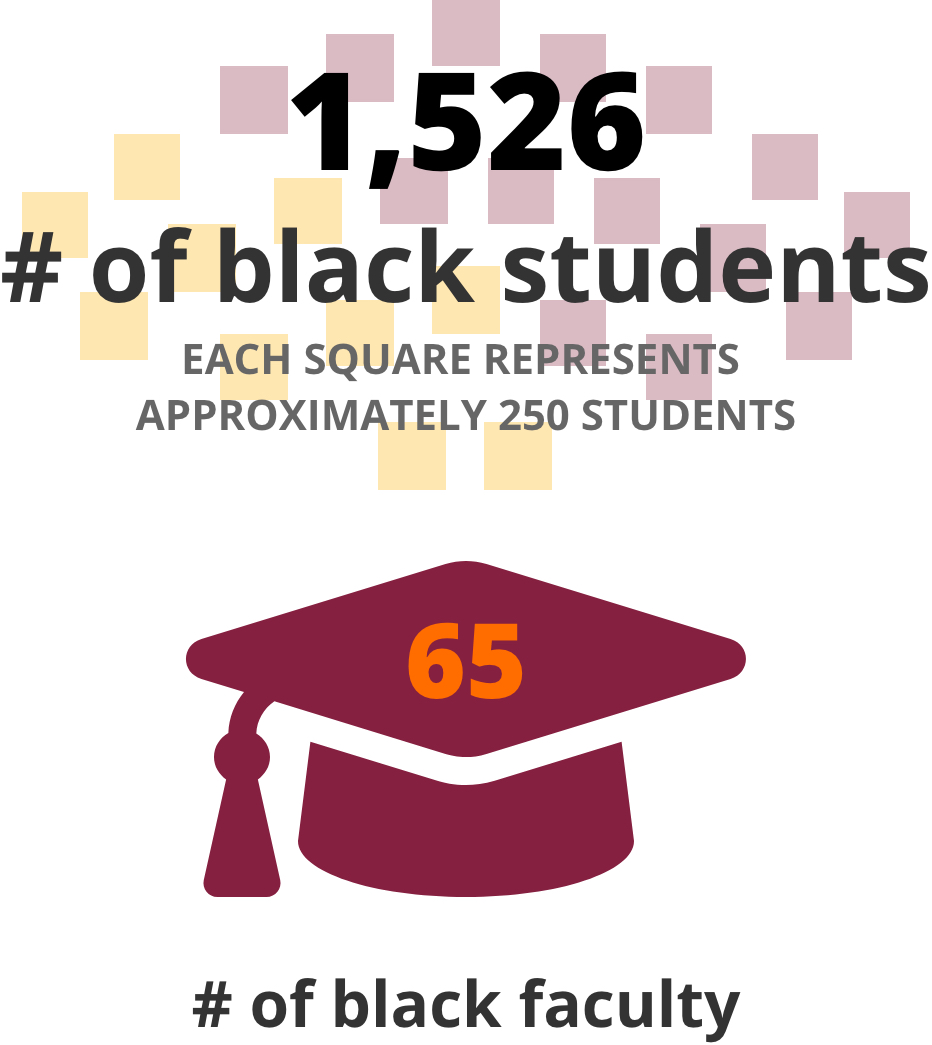
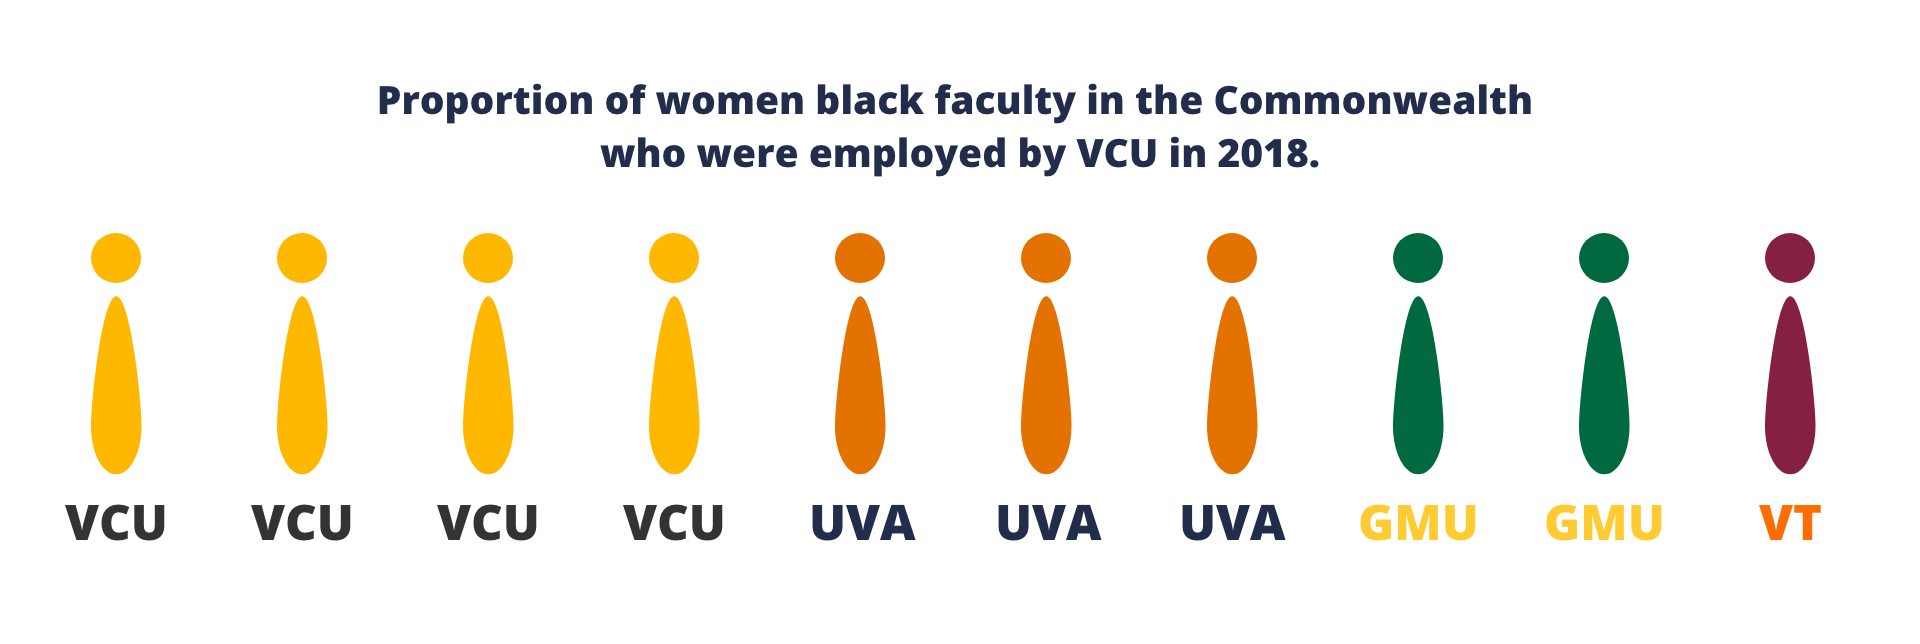
Proportion of women black faculty in the Commonwealth who were employed by VCU in 2018

Black instructional faculty also comprised a higher percentage of total faculty at VCU than at GMU, UVA and VT. When taking into account the total instructional faculty headcount, VCU’s 6.2% exceeds the percentage of black faculty at UVA (4.4%), GMU (4.3%) and VT (3.3%). Importantly, VCU has either met or exceeded the ~5% national average for black faculty for the past decade. Even with a decrease in the total headcount of black instructional faculty between fall 2013 and fall 2014, VCU’s average headcount for black instructional faculty remained higher than all other research universities in the Commonwealth.

Table 3 - Black faculty makeup across research institutions in Virginia, 2018

What is more is that between 2015 and 2018, VCU’s black faculty headcount increased at a rate that was greater than each of the other research universities. Between 2015 and 2018, VCU averaged an increase of 1 black faculty for every 4 faculty added to the headcount; GMU, 1 in every 5; UVA, 1 in every 7; and VT, 1 in every 12. This is rather exceptional, compared to 2013-2014, when VCU lost a black faculty member for every 33 faculty added to the headcount (a decrease in headcount by two black faculty); VT lost a black faculty for every 12 faculty added; whereas UVA added 1 in every 17; and GMU added two black faculty despite an overall loss of faculty.

Former VCU faculty Ravi Perry, Ph.D. and VCU president Michael Rao, Ph.D engaged in conversation at a 2015 town hall
Former VCU faculty Ravi Perry, Ph.D. and VCU President Michael Rao in an exchange during a diversity and inclusion town hall in 2015. (University Public Relations, VCU)

Few understood the reasons why VCU students would stage protests and sit-ins on campus. A solidarity march with Mizzou students, yes. But, protests and sit-ins? VCU, after all, was the most racially and ethnically diverse, research university in the Commonwealth. So, what was there to complain about?

Well, to understand this, we need to go back at least one year prior to the affirmation period. At the end of the 2013-2014 academic year, black student headcount at VCU was officially on a downward trend. In fact, between 2012 and 2014, black student enrollment at VCU had decreased 5% (5,055 to 4,798); black student retention and graduation rates continued to lag far behind their peers; and, a narrative that VCU didn’t care about its black students began to take shape.

In response, VCU administrators sprung into action by announcing a task force on the “Innovative Recruitment of Under-represented Minority Students from Central Virginia” in August 2014. Ten months later, in May 2015, the task force offered six recommendations that ranged from implementing a standardized test-optional admission process, to providing more financial aid and scholarships, to partnering with local school districts to create pathway and pipeline programs. While the work of the taskforce would later prove significant and valuable with respect to increasing minority student access; at the time, its recommendations fell short of addressing the students’ primary concerns about why they were leaving. Students did not feel heard.

"No student, black or white, should go through four years of college and never have a black professor,” he said. “It’s not good for them, nor is it good for society."

In fact, VCU students attributed their own retention issues to the lack of black professors on campus who could relate to their lived experiences. They expressed disappointment with the availability of university counseling and support services on campus. They believed the cultural resources on campus -- centers and other spaces -- to be woefully inadequate. Ironically, these concerns would surface again a year later ...in the students’ list of formal demands.

But it wasn’t only students who were vocal about the declining significance of black students vis a vis black lives on campus. In a December 2014 Richmond Times Dispatch (RTD) opinion piece, a prominent VCU professor argued for a counter-track to the Innovative Recruitment of Under-represented Students task force already halfway through its work. To some, there was an inherent connection between the recruitment and retention of black students and the recruitment and retention of black faculty. Further, their reciprocal representation on campus was believed to be beneficial for all.

In February 2015, VCU hired an external consultant to help in developing strategies to strengthen inclusive hiring of women and minorities. Four months later, upon the release of the interim report, there were very few actionable items other than 1. To “adopt a [planning] framework..”, 2. To capture “data...”, 3. To establish a “vetting process...” for plans, 4. To conduct an “assessment...” and 5. To form “the structure of a council for inclusive excellence...”. Thus, by November 2015, students had lost their patience.

"We are tired of hearing about year old ‘initiatives’ that are never set into action, given measurable outcomes, and/or accountable deadlines. We are tired of the impromptu ‘diversity dialogues’ that are created just to appease us for the time being. We are tired of the lackluster sense of urgency surrounding these issues,” reads the group’s statement. “We will no longer be pushed to the side. We matter." - Commonwealth Times, Nov. 2015

Key Findings

On black faculty proportional representation...

It is a common practice for educational institutions to compare faculty headcount to student headcount. The lower the faculty to student ratio, then the greater the perceived engagement and support for students. The same applies to black faculty to black student proportional representation, especially for those who believe black faculty play a unique and substantive role in the success of students. Let’s take a look at their proportional representation at VCU as well as their representation at peer institutions in the Commonwealth.

“We will no longer be pushed to the side. We matter." - Commonwealth Times, Nov. 2015

At VCU, in fall 2018, there was roughly 1 instructional faculty for every 12 students. If we were to disaggregate faculty composition by race / ethnicity, and then compare to total student headcount, we observe 1 black instructional faculty for every 225 students; 1 URM faculty for every 134 students; 1 Asian faculty for every 100 students; and 1 white faculty for every 20 students.

If we were to decompose both faculty and student headcounts based on race / ethnicity, then there was 1 URM faculty for every 43 URM students; 1 black faculty for every 40 black students; 1 Asian faculty for every 12 Asian students; and 1 white faculty for every 9 white students.

Proportion between specific faculty and student groups at VCU

VCU’s black faculty headcount has increased since 2013, and even more so since 2015; however, it hasn’t kept pace with black student headcount. This is much of the case across research universities in the Commonwealth.

Comparative proportion tests reveal that, in every year since 2013, black faculty have been significantly underrepresented at each of the four research universities (noted exception was VT in 2013), while white faculty have been significantly overrepresented. At VCU, black faculty underrepresentation seemed to be much more pronounced than at other research universities, due in large part to the percentage or proportion of black students relative to the total student body. To fully appreciate and comprehend what this means, in fall 2018, VCU matriculated almost half (43%) of all black students enrolled at research institutions in the Commonwealth.

Comparison between VCU and Other Research Universities in Virginia

Click on an institution's proportional representation tab to compare to VCU's representation.

Proportional Representation at VCU
VCU logo
Illustration of proportion between black students and black faculty at VCU
Virginia Tech logo Illustration of proportion between black students and black faculty at Virginia Tech
George Mason University logo Infographic on the proportion of black students to black faculty at GMU
UVA logo Illustration of proportion between black students and black faculty at UVA

As noted above, the argument for increasing black faculty proportional representation centers on their availability, engagement and support of students. However, the challenge for VCU is it admits an average of 5,000 new students (of which approximately ~17% or more identify as black) compared to hiring only 125-150 new faculty (of which 10-20% identify as black) each academic year. What is more, some states like Virginia allow for race / ethnicity to be a compelling and complementary factor in the admission of students, whereas hiring on the basis of race is not permitted under federal and state law. Thus, increasing URM or black faculty representation is not as easy as filling a quota of some sort, which is both illegal and undesired. This is not an excuse for the underrepresentation of black faculty to black students. Rather, it is an opportunity to explore other opportunities for addressing this important issue.

There must be systems-level changes that involve innovating academic and research programs; transforming curriculum in terms of design, pedagogy and structure; and, of course, rethinking ‘human capital to human resource’ translational processes with respect to faculty recruitment and retention. At VCU, if there truly has been an affirmation of the value of black faculty since 2015, then it may not be fully evident in their proportional representation. However, it most certainly should be reflected in the university’s success in black faculty recruitment and retention. Let’s take a look.

Female faculty member lecturing to a group of students in a classroom

VCU Human Resources and VCU Insights data were used to observe trends in faculty recruitment. VCU Insights data reports on T&R faculty, exclusively. At VCU, T&R faculty are subdivided into three categories: non-tenure track or term faculty, tenure-track faculty, and tenured faculty. Importantly, T&R faculty data may not align with what was reported in previous sections using IPEDS data on instructional faculty.

Key Findings

On black faculty recruitment...

Faculty recruitment can be viewed as who has applied and who has been hired. Below, we share data and insight on black faculty recruitment at VCU.

There were more than 21,000 applicants for VCU faculty positions between 2012 and 2018. Based on estimates using applicant’s submission of voluntary demographic information, 6% to 8% of applicants for faculty positions were black. This is compared to 10% to 12% who identified as URM, 10 to 13% who identified as Asian, and 72% to 76% who identified as white. Note: It is believed that roughly 70% of all applicants submitted demographic data.

In terms of gender, women represented about half (48.5%) of all faculty applicants between 2012 and 2018. Among black faculty applicants, black women accounted for 61% of applicants compared to 39% for black men. This is the only demographic group (black vs. URM, Asian and white) where there was a greater percentage of women than men who applied.

There also was a slight uptick between 2012-2014 and 2015-2018 in the average percentage of applicants who identified as black (7.1% vs. 7.6%), URM (10.8% vs. 11.7%) and Asian (10.6% vs. 11.4%). This corresponds to an average percent decrease among white applicants between these time periods (7.6% vs. 7.4%).

In terms of new faculty hires, VCU hired a total of 1,391 T&R faculty between 2012 and 2018. Of the new hires, 99 were black faculty, 201 were Asian faculty, 161 URM faculty (includes black faculty) and 847 were white faculty.

Table 4 - VCU T&R New Hires by Race/Ethnicity

Whereas black faculty made up only 5.1% of the new hires between fall 2012 and fall 2014, they comprised 8.7% of the new hires between fall 2015 and fall 2018. This represents a +41.3 ppt increase in black new faculty hires. Comparatively, between 2015 and 2018, there was an -11 ppt decrease in Asian new faculty hires and an -8.5 ppt decrease in white faculty hires.

In reference to term and tenure track / tenured new hires, among the 99 black new faculty hires, 65 were term hires (65.7%) and 34 were tenure track / tenured hires (34%). The percentages of black new hires across T&R faculty categories were somewhat similar for Asian new hires (n = 142, 71%, term; n = 59, 29%, tenure track / tenured) and white new hires (n = 643, 75%, term; n = 204, 25%, tenure track / tenured).

Of particular note here is the pattern of tenure track / tenured faculty new hires between 2012-2014 and 2015-2018. Comparing these time periods, the percentage of tenure-track / tenured new hires for black faculty increased from 12.5% (2012-2014) to 44.7% (2015-2018); but remained relatively unchanged for white faculty (23.3%, 2012-2014; 26.7%, 2015-2018) and even decreased for Asian faculty (32%, 2012-2014; 27.6%, 2015-2018).

Table 5 - VCU T&R faculty new hires by race / ethnicity and appointment type, 2012-2014 and 2015-2018

Based on this data, black faculty recruitment at VCU has improved the past few years, especially for black women faculty. Just as important, there appears to be some progress in black faculty securing tenure-track / tenured positions rather than term-limited positions. Now that we know VCU has had some success in recruiting black faculty, let’s see if these faculty are actually staying and, if so, then for how long.

woman writing on the whiteboard

Some believed that VCU had done a great job of marketing diversity in an effort to recruit black students and faculty. However, there’s the prevailing belief that once these students and faculty arrived on campus, little was done to provide an inclusive and supportive environment to ensure their retention and success. This bait-and-switch perspective seemed to resonate with several students and faculty who saw the university presenting to the outside world as a diverse institution, but within its campus borders, being nothing of the sort.

"We need VCU to end its search for cosmetic diversity and work towards real diversity." - November 2015

Data from a VCU faculty and staff climate survey seems to partially support that claim. If we operationalize “real diversity” as an inclusive environment that is cooperative, empowering, fair and open, then, in this way, black faculty perceive a less inclusive climate than their white faculty colleagues. Further, their perceptions of a less inclusive environment is predictive of their lack of engagement in their academic unit -- in terms of their intrinsic work experiences, their belief in leadership, and their support from supervisors.

But, black faculty’s less favorable perceptions of climate do not predict their departure from the university over-and-beyond what climate predicts in the departures for other faculty. Stated another way, climate seems to matter for all faculty who might consider leaving a university. And, just as important, climate isn’t the only thing that matters when it comes to faculty departures, especially in black faculty departures.

The decisioning process for black faculty on whether to stay or leave a university is complex and multivariate. A myriad of factors may play a role in their attrition or retention. Climate, of course. Then there’s competitive salary offers, contractual terms, dual career decisions (e.g., partners and spouses), teaching and research collaborations, geographic location, prestige of the institution, and professional growth opportunities. To characterize black faculty as being hypersensitive or over-reactive to climate matters undermines their agency in determining their own professorial trajectory.

The decisioning process for black faculty on whether to stay or leave a university is complex and multivariate.

With this in mind, there may be some value in considering a macro-perspective on black faculty recruitment and retention. The affirmation period (circa Fall 2015) could have served to reopen a recruitment market that had been closed to black faculty in years prior. Black faculty mobility (i.e., leaving one university to go to another university) might have been accelerated during this time, due in part to colleges and universities wanting to demonstrate their responsiveness to the current crisis as well as black faculty realizing new opportunities where their teaching and research might become more prominent. In essence, black faculty mobility may have had as much to do with a destination institution’s highly persuasive marketing of diversity as it did a home institution’s lack of real diversity.

Newspaper coverage of universities planning to invest in diversity initiatives

In the next section, we observe faculty retention rates for VCU faculty from 2012 to 2018. We pay close attention to trends that may suggest a unique pattern of attrition and retention for black faculty, 2012-2014 and 2015-2018.

Key Findings

On black faculty attrition and retention...

Faculty attrition or loss is the number (or percentage) of faculty who were not retained by the university during a specific time period. It is computed as the number of faculty losses by total headcount (x 100). Faculty retention is 1 minus the rate of faculty attrition or loss. For example, in an academic unit with 10 new faculty hires, if two faculty members left before the beginning of their second year, the annual attrition rate would be 20%; and the one-year retention rate would be 80%. Both faculty attrition and faculty retention speak to a university’s ability to maintain a capable and committed workforce.

Overall, VCU’s T&R faculty retention rates have followed a predictable pattern of decline from the initial years (Years 1-3) through the later years (Years 4-6) of the professorial lifespan. Of significant import, however, is the decline in retention rates has been more precipitous in the later years for black faculty than for other faculty. This trend is evidenced in average retention rates for all new faculty hires (and for black new faculty hires) from Fall 2012 through Fall 2018. The average one-year retention rate for new faculty was 88.3% (92.3%); the average two-year retention rate was 79.2% (81.2%); the average three-year retention rate was 71.8% (68.8%); the average four-year retention rate was 64.5% (59.5%); the average five-year retention rate was 61% (48.9%); and the average six-year retention rate was 55.9% (38.0%).

There also is evidence that overall faculty retention rates for Years 1-3 have improved since 2012, while retention rates for later years have been substantially lower and less improved. The one-year retention rate (i.e., those new faculty hires who returned for a second year) improved from 85.6% (Fall 2012 cohort) to 89.8% (Fall 2018 cohort); the two-year retention (i.e., those who returned for a third year) remained relatively flat at 80.7% (Fall 2012 cohort) to 80.1% (Fall 2017 cohort); and the three-year retention (i.e., those who returned for a fourth year) improved from 71.3% (Fall 2012 cohort) to 78.4% (Fall 2016 cohort).

However, the four-year retention rate (i.e., those who returned for a fifth year) declined from 65.7% (Fall 2012 cohort) to 61.0% (Fall 2015 cohort); and the five-year retention rate (i.e., those who returned for a sixth year) and the six-year retention rate (i.e., those who returned for a seventh year) increased only slightly, 59.1% (Fall 2012 cohort) to 62.3% (Fall 2014 cohort) and 54.7% (Fall 2012 cohort) to 57.1% (Fall 2013 cohort), respectively.

Table 6 and 7 - T&R faculty retention rates and black faculty retention rates at VCU

For black T&R faculty cohorts, the retention rates followed a similar pattern to the total faculty. However, there were three notable exceptions. First, there were substantially fewer black faculty new hires in 2012, which impacted retention percentage rates in a manner not evidenced for the total faculty. Second, the differences between Year 1-3 retention rates and Year 4-6 retention rates were more pronounced for black faculty than for total faculty. And, third, despite the number of black new hires in 2012, the retention rates between black faculty cohorts were less stable than what was observed for all faculty.

The one-year retention rate for black new faculty hires improved from 85.7% (Fall 2012 cohort) to 94.3% (Fall 2018 cohort); the two-year retention rate improved from 57.1% (Fall 2012 cohort) to 85.2% (Fall 2017 cohort); and, the three-year retention rate improved from 42.9% (Fall 2012 cohort) to 84.6% (Fall 2016 cohort). This is contrasted to the four-year retention rates that ranged from 42.9% (Fall 2012 cohort) to 47.4% (Fall 2015 cohort); the five-year retention rates of 14.3% (Fall 2012 cohort; 1 of 7 faculty) and 80% (Fall 2014 cohort); and the six-year retention rates that ranged from 28.6% (Fall 2012 cohort; 1 faculty returned to the university) to 47.4% (Fall 2013).

Importantly, the distribution of non-tenure track to tenure-track / tenure faculty between total faculty and black faculty wasn’t a notable factor in retention rate differences.

We also considered whether one-, two- and three-year retention rates for black faculty improved across time periods: 2012-2014 and 2015-2018. One-year average retention rates for black faculty improved from 88.2% (2012-2014) to 95.4% (2015-2018). Their two-year average retention rates rose from 76.9% (2012-2014) to 85.4% (2015-2018). And, their three-year average retention rates increased from 65.3% (2012-2014) to 73.9% (2015-2017). There were not enough available timepoints to compute comparative rates for four-, five- and six-year retention.

On the whole, VCU lost a significant percentage of its faculty after their third year, with black faculty having exited at a higher rate during their fourth, fifth and sixth years. This is particularly problemsome because, within three years, these faculty have likely formed engaging and meaningful relationships with other faculty as well as students with whom they interact in advising, mentoring, research and teaching domains. The departure of these faculty, often unanticipated by most of their faculty colleagues and students, can exact an administrative and financial strain on unit resources, disrupt teaching schedules and collaborative faculty research activities, and unfairly limit students’ educational experiences. The exit of black faculty, where there are few to begin with, can further exacerbate any extant climate issues and lead to alienation and mistrust among remaining black and URM faculty and students. While there is encouraging evidence that VCU faculty retention rates have improved for black faculty in recent years (2012-2014 vs. 2015-2017), there obviously is work that needs to be done to retain faculty in their later years.

A professor point at a student who is raising their hand

Many students in fall 2015 focused their attention on black faculty turnover. Black faculty seemed to come and go at a rate that was much more accelerated than for other faculty. And whether it was campus climate or better opportunities elsewhere, students demanded that their universities find better ways to retain black faculty; or, at the very least, replace black faculty who leave the university with black faculty in comparable appointment types (e.g., tenure-track to tenure-track). Before we examine black faculty turnover at VCU, let’s take a moment to fully understand what faculty turnover is and how best to interpret it.

Faculty turnover is the percentage of faculty who leave the university and are replaced by new faculty hires during a specific time period. In computational terms, faculty turnover is the ratio of faculty losses to averaged faculty headcount (x 100). While there isn’t a true average rate for faculty turnover across all U.S. colleges and universities, turnover estimates do tend to range between 2 and 10% (and, as high as 22% for administrative faculty turnover). Turnover rates also vary across institution-type due to their mission, prestige, and size. Importantly, faculty turnover rates for research universities tend to be relatively stable across time.

Unlike employee turnover rates in the business sector, faculty turnover rates in higher education only occasionally creep into the double digits and rarely, if ever, exceed 100%. There are instances when faculty turnover rates for small academic units could be quite high. Such high rates usually are related to unit differences in faculty appointment-types (e.g., tenure track vs. non-tenure track or temporary faculty) or unit differences in faculty composition. For instance, it may not be entirely uncommon for turnover rates among underrepresented minority (URM) faculty groups to be substantially higher in academic units that have few URM faculty compared to units with significantly more URM faculty.

Case in point: If during an academic year, two units each with 5 total faculty had lost 2 URM faculty members and hired 1 new URM faculty member, with the only difference between the units being that one unit started the year with 2 URM faculty and the other with 4 URM faculty, then the overall faculty turnover rate for each unit would be exactly the same. URM faculty status is irrelevant in overall faculty turnover rates. However, if we computed the URM faculty turnover rate for each unit, then the turnover rate for the unit with only 2 URM faculty would be almost 2.5 times higher than the rate for the unit with 4 URM faculty (133% vs. 57%), even though URM faculty attrition (-2) and URM new faculty hires (+1) for the units were the same.

Therefore, any discussion about faculty turnover that focuses on the transitional state of faculty (i.e., black faculty or otherwise) should be done in context (e.g., unit or university level) and also with nuance and reflexivity.

Faculty turnover, similar to attrition and retention, is generally interpreted within the context of a university’s culture, organizational structure, competitive salary, market conditions and professional development opportunities. The costs associated with high faculty turnover are substantial and ubiquitous, as there are economic and educational ramifications that affect virtually every level of the university. Curriculum and classroom management, faculty administration and governance, standing committees and task forces, advising and mentorship -- all suffer with high rates of faculty turnover. In the case of black faculty turnover, the ability for the university to recruit other black faculty also suffers. Simply put, losing black faculty makes it much more difficult to recruit black faculty.

VCU students called for there to be a: '...proportionate increase in the number of tenured black professors to the overall increase in faculty, taking into account those who retire or leave the university.'

So, now let’s return to November 2015 and take another look at the student’s list of formal demands. VCU students called for there to be a: '...proportionate increase in the number of tenured black professors to the overall increase in faculty, taking into account those who retire or leave the university.'

Stated another way, the higher the number of black faculty losses, then the higher the number of black faculty new hires are needed to keep pace with the overall growth of the total faculty headcount. Although incredibly challenging, universities that experience a decline or setback during the initial years do have the opportunity to mitigate those faculty losses, and even their turnover rate, in subsequent years. Let’s take a look at VCU’s faculty turnover rates and also determine the extent to which these rates improved or deteriorated post fall 2015.

Key Findings

On black faculty turnover...

The VCU T&R faculty turnover rate declined from 8.8% in 2012 to 7.8% in 2018. Across all years, non-tenure track average turnover (9.4%) exceeded turnover for tenure-track (5.4%) and tenured faculty (6.9%). This turnover pattern was expected because non-tenure track faculty, in general, have revolving or terminal contracts of 1-, 2- or 3-years, and these faculty are more frequently rehired or replaced than tenure-track and tenured faculty. In fact, in past years, non-tenure track faculty were labeled rather crudely as ‘collateral’ faculty.

Table 8 - T&R faculty turnover rates at VCU

Black T&R faculty turnover rates decreased from 9.9% in 2012 to 8.6% in 2018. However, unlike the pattern observed for overall faculty, there was little to no differentiation in turnover rates across all T&R faculty types. For black non-tenure-track faculty, the average turnover rate was 9.7%; for black tenure-track faculty, 9.6%; and for black tenured faculty, 8.7%. Thus, differences between non-tenure track and tenure-track and tenured faculty, for example, in the type of faculty contract, did not seem to be a factor in their turnover.

In terms of time period (2012-2014; 2015-2018), black faculty turnover rates decreased from an average rate of 10.7% (2012-2014) to 8.1% (2015-2018). Decomposing T&R faculty, the decreased rate was largest among tenure-track faculty, 17.6% (2012-2014) to 3.6% (2015-2018) followed by non-tenure-track faculty 10.8% (2012-2014) and 9.0 (2015-2018). However, among black tenured faculty, the turnover rate increased from 6.7% to 10.2% (2015-2018).

Table 9a - Tenure track faculty turnover rates at VCU
Table 9b - Tenured faculty turnover rates at VCU

The increased turnover rates for tenured faculty compared to tenure-track faculty were not completely surprising given that tenured faculty tend to represent an older demographic (perhaps, of retirement age) than tenure track faculty. However, of special note here is the increase in average turnover for black tenured faculty between 2012-2014 and 2015-2018, which may lend support to the perspective about the enhanced mobility of successful black faculty presented in a previous section.

We will know better the reasons for faculty turnover in the coming months. VCU is currently participating in a multi-university study on faculty retention and exit sponsored by Harvard University’s Collaborative on Academic Careers in Higher Education (COACHE). When the results are released, we will be in a position to unpack the above-referenced findings related to black faculty retention and turnover.

Male professor teaching to a small group of students

Key Findings

On black faculty promotion and success in the professoriate...

Success in the professoriate is determined in large part by faculty promotion (and tenure for those on the tenure-track). For T&R faculty, the most typical pathway to success begins as an assistant professor (although, there are some faculty who begin as instructor). Within seven years, it is expected for these assistant professors to be promoted to associate professor (with tenure, for those on the tenure-track). And, within five to seven years of being an associate professor, it is expected for faculty to be promoted to full professor.

For any number of reasons, faculty may not progress through the ranks according to a prescribed timeline. These reasons include but are not limited to academic and family leave, assignment of administrative duties, contract type, performance, and retention considerations. Nonetheless, T&R faculty, especially tenure-track and tenured faculty, are expected to demonstrate a reasonable and timely progression through the ranks.

Below, we take a look at the distribution of T&R faculty across ranks. We also take a snapshot of VCU’s tenure-track faculty in fall 2012, and we follow them for six to seven years to better understand the professorial trajectory of faculty, in particular black faculty.

The distribution of T&R faculty across promotable ranks remained remarkably consistent for the past decade (2012, 2018): instructors (12.2%, 11.5%), assistant professors (39.0%, 40.1%), associate professors (25.8%, 27.1%) and full professors (19.8%, 19.2%). VCU’s distribution of T&R faculty seems on par with other research universities, with the majority of T&R faculty residing in assistant and associate professor ranks.

In 2012, compared to all faculty, black faculty were slightly overrepresented as instructors (14.5%) and associate professors (31.2%); and they were slightly underrepresented as assistant professors (36.5%) and full professors (17.7%). By 2018, black faculty remained overrepresented as instructors (14.1%). They also transitioned from being underrepresented as assistant professors in 2012 to being overrepresented (47.2%) in 2018. Their representation within the associate professor ranks decreased (23.9%), while remaining underrepresented as full professors (14.7%). Point of fact, distribution percentages for Asian and white T&R faculty remained relatively constant between time periods.

Table 10 - T&R Faculty appointment trends for VCU black faculty

Overall, between 2012 and 2018, an estimated 680 faculty were promoted to assistant, associate or full professor ranks: 105 to assistant, 415 to associate and 161 to full professor. Of these, thirty-one promotions (4.5%) were awarded to black faculty: 8 to assistant (7.6%), 17 to associate (4.0%) and 6 to full professor (3.7%). Comparatively, White faculty accounted for 72.2% of promotions, Asian faculty accounted for 14.9% of promotions, and URM faculty (including black faculty) accounted for 8.8% of promotions.

Tenure Track faculty at VCU:
Fall 2012 Cohort (248 Faculty)

Tenure success within six years:
Asian 31 of 40 (77.50%)
Black 5 of 11 (45.45%)
White 89 of 158 (56.33%)
Everyone else 21 of 39 (53.85%)
Left VCU while on tenure track:
Asian 8 of 40 (20.00%)
Black 4 of 11 (36.36%)
White 55 of 158 (34.81%)
Everyone else 13 of 39 (33.33%)
Remained on tenure track after six years:
Asian 1 of 40 (2.50%)
Black 2 of 11 (18.18%)
White 14 of 158 (8.86%)
Everyone else 5 of 39 (12.82%)

Tracing the pathways of all tenure-track faculty from Fall 2012, the tenure success rate within six years was highest for Asian faculty at 77.5%, followed by white faculty at 56%, and then black faculty at 45%. Thus, less than half of black faculty on the tenure-track during fall 2012 were successful in being awarded tenure. Moreover, 18.8% of black faculty remained on the tenure-track after six years, compared to 8.8% of white faculty and 2.0% percent of Asian faculty.

The promotion and success scenario for black T&R faculty is both complex and complicated. On the one hand, there has been tremendous growth into the early phases of the professorial pipeline. Between 2012 and 2018, the number of black assistant professors had more than doubled. On the other hand, noted attrition within associate and full professor ranks relative to total faculty may signal a disruption in the pipeline that uniquely impacts black faculty. What further complicates this scenario is that relative to their total population, black T&R faculty have been underrepresented in promotions, whereas Asian faculty have been equally represented and white faculty overrepresented. This lack of progression is noted in the percentage of black faculty who leave or remain in promotable and tenurable positions after six years.

The disruption to the professorial pipeline for black T&R faculty could be related to any number of factors to include climate, mobility, performance, and recruitment and retention at senior ranks. But, whatever the reasons may be, the retention and success of VCU’s black T&R faculty deserves our focused and highly resourced attention. For theirs and our students successes are inextricably intertwined.

Student at the library with one hand on books and looking at the camera

All of our students who chose to sit-in administrative offices because they stood for something; who stayed silent in auditoriums because they wanted to be heard; who laid down at the Compass to raise a critical consciousness … to all of them… they should be commemorated for their courage, their insight and intelligence, their perseverance, and their selflessness. Many of the students here in Fall 2015 have since graduated from our university, leaving with a challenged and conflicted hope about the state of affairs involving black students and black faculty. But, with their commencement began our quest toward transforming our university and not just the communities around us.

James Balwin wrote “the challenge is in the moment, the time is always now.” In this way, we must continue to make our future university “responsive to and grounded in our community-of-experience.” This requires us to “dig deep” into our past in order to view what possibilities lay ahead for us. We mustn’t shy away from what we find, as we are an adjoiner between the lived experiences of our students and the fulfilled expectations of our faculty. Indeed, we will make this a transformative journey for our university.

This Brief Report on the State of VCU’s Black Faculty is the first of a series of “dig deep” expositions that will tackle issues that underlie the culture and climate of our university. We hope this work will move us beyond mere conjecture and provide us with data that allows for honest, enlightening and difference-making discussions.

References

Baldwin, James. 1956. Faulkner and Desegregation. Foundation for Cultural Projects.

Higher Education Publications, Inc. April 2018. College Administrator / Data Turnover Rates, 2016 - Present

Kapsidelis, Karin. December 27, 2014. Black faculty at VCU fight decline in their ranks. Richmond Times Dispatch.

Libresco, Leah. December 3, 2015. Here are the demands from students protesting racism at 51 colleges. FiveThirtyEight.

Serequeberhan, Tsenay. 2015. Existence and Heritage: Hermeneutic Explorations in African and Continental Philosophy. State University of New York Press.

The Commonwealth Times. November 16, 2015. Administration responds to Black VCU Speaks. The Commonwealth Times: The Independent Press of Virginia Commonwealth University.

Acknowledgements

Holly Bailey, Research and Business Analyst, in VCU’s Office of Institutional Research and Decision Support (IRDS) and the Office of Institutional Equity, Effectiveness and Success prepared the data for this report. Manny Liban, Director of Communications and Information Management, in the Office of Institutional Equity, Effectiveness and Success provided creative direction for this report. Archana Pathak, Ph.D., Special Assistant to the Vice President in the Office of Institutional Equity, Effectiveness and Success, provided comments on an earlier draft of the report.